COMPANIES ARE CREATING VALUE FOR THEIR SHAREHOLDERS IN A MORE AND MORE ORIGINAL WAYS. THEY BET ON VARIOUS THINGS: INNOVATIVE BUSINESS MODELS, ECONOMIES OF SCALE, COMPETITIVE ADVANTAGES ETC. APPROACHES DIFFER AND SOME MAY EVEN LOOK STRANGE FOR THOSE THAT DO NOT REALLY HAVE A STRONG FINANCIAL BACKGROUND – CASE OF HOME DEPOT INC.
Company Home Depot Inc. is a US retail giant, selling equipment for home, garden and workshop. Their products and services are sold throughout the network of 2.200+ stores in USA, Canada, Mexico and online. The company is the biggest retailer worldwide in its segment. In financial year 2017 the company generated 101,0 billion USD net sales and 16,5 billion USD EBITDA. More than all non-financial legal entities in a smaller country such as Slovenia, EU.
Why is increasing the financial debt beneficial?
The company operates in a smart way. Part of the success story is linked also to the financial structure and its restructuring. In last years the company is increasing the level of financial debt and decreasing the level of equity. In this way Home Depot Inc. is increasing its Return on equity (ROE). Meaning, the shareholders’ equity is being managed in a more and more efficient way. Let’s look more in details how this is possible.
Development of invested capital and return on equity (ROE) of Home Depot Inc.
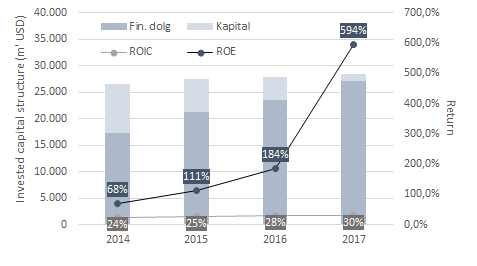
Source: Home Depot Inc. Consilue analysis.
Invested capital as at the end of FY 2017 amounts to 28,5 billion USD. Financial debt equals 27 billion USD and shareholder’s equity 1,5 billion USD. One can quickly notice that the indebtedness measured as D/E ratio is »very high«, 1611%. Nevertheless, the ratio as such is not really problematic. The key is to consider the market (not book value) indebtedness ratio. In the case of Home Depot Inc. future returns on invested capital are expected significantly above the weighted average cost of capital (WACC). The market value of equity therefore significantly (more than 100x) exceeds its book value, making the healthy debt levels significantly higher.
The more value the company creates, the higher the optimal levels of debt. As the debt levels built, the ease of creating value for shareholders increase. And the system works as a spiral. The more debt there is, the higher the value for shareholders.
Financial debt and debt management
Financing mix with a leverage as in the case of Home Depot Inc also brings challenges. A mistake in managing financing can have serious consequences. Financial debt can quickly show its other face. Proper supervision of risks and stabilization of future cash flow is therefore of crucial importance. Management of Home Depot Inc. is well aware of this fact. They are eager to continuously strengthen the underlying competences. Especially those that influence the increase in gross margin and further development of competitive advantages.
Financial debt is being managed carefully. Risks related to new obligations and danger of eventual liquidity gaps are continuously addressed in a proper way. The majority of debt is of long-term nature. Its maturities match the maturities of underlying projects. The company does not seek to create »fast« profits at the expense of differences in maturities. The company is aware of risks and the fact that this is not really their business.
Table of financial debt as at the end of FY 2017 (m’ USD):
| Short-term financial debt | |
| Loans given by the consortium of banks | 1.559 |
| Short-term portion of long-term financial obligations | 1.202 |
| Long-term financial debt | |
| Bond – Sep 2017; Var. OM; quarter interests | / |
| Bond – Sep 2018; 2,25%; semi-annual interests | 1.137 |
| Bond – Jun 2019; 2,00%; semi-annual interests | 998 |
| Bond – Jun 2020; Var. OM; quarter interests | 499 |
| Bond – Jun 2020; 1,80%; semi-annual interests | 748 |
| Bond – Sep 2020; 3,95%; semi-annual interests | 501 |
| Bond – Apr 2021; 4,40%; semi-annual interests | 998 |
| Bond – Apr 2021; 2,00%; semi-annual interests | 1.343 |
| Bond – Jun 2022; 2,625%; semi-annual interests | 1.243 |
| Bond – Apr 2023; 2,70%; semi-annual interests | 996 |
| Bond – Feb 2024; 3,75%; semi-annual interests | 1.093 |
| Bond – Sep 2025; 3,35%; semi-annual interests | 995 |
| Bond – Apr 2026; 3,00%; semi-annual interests | 1.287 |
| Bond – Sep 2026; 2,125%; semi-annual interests | 9.86 |
| Bond – Sep 2027; 2,80%; semi-annual interests | 993 |
| Bond – Dec 2036; 5,875%; semi-annual interests | 2.949 |
| Bond – Sep 2040; 5,40%; semi-annual interests | 495 |
| Bond – Apr 2041; 5,95%; semi-annual interests | 988 |
| Bond – Apr 2043; 4,20%; semi-annual interests | 988 |
| Bond – Feb 2044; 4,875%; semi-annual interests | 978 |
| Bond – Mar 2045; 4,40%; semi-annual interests | 977 |
| Bond – Apr 2046; 4,25%; semi-annual interests | 1584 |
| Bond – Jun 2047; 3,90%; semi-annual interests | 738 |
| Bond – Sep 2056; 3,50%; semi-annual interests | 971 |
| Financial leasing – fixed and variable liabilities until Jan 2055 | 984 |
| Minus: Short-term portion of long-term financial obligations | -1.202 |
| Total | 27.028 |
Source: Home Depot Inc. Consilue analysis.
The financial structure is despite the relatively leveraged financial mix, stable. What makes it sustainable is the value that is being created. Additionally, the lenders are also well aware of the fact that the ratio Net debt / EBITDA as at the end of FY 2017 amounts to »only« 1,4x. This fact additionally strengthens the position of the company. It messages that in case of tightening, the financial debt can still be relatively quickly repaid with operational cash flow.
The success story described above still has space to develop further. The debt levels are not yet optimal, meaning that in the area of debt management there is still space for improvements and value creation. Yield to maturity for 10-year bonds is below 5,0%, meaning that eventual increase of debt levels is further improving the weighted average cost of capital.
The developments described are strongly appreciated by the investors. The value of the Home Depot Inc. stock in last 7 years strongly outperformed competitive peer companies. The growth was truly significant, from 30 USD/share to 200 USD/share. Furthermore, the company was also paying out dividends. Compounded annual growth rate (CAGR) of the Home Depot Inc. stock in the period that matches FY 2011 – FY 2017 amounts to 28,5%, compared to the 9,6% growth of S&P Retail index.
Chart: Stock price development
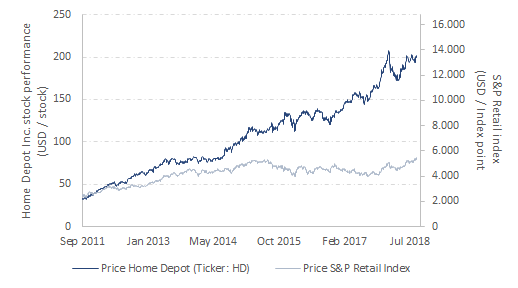
Source: Bloomberg. Consilue analysis.
As we see, the financial debt is taking the nature of equity. D.E.B.T. is the magic word or key to a success of Home Depot Inc. The more the indebtedness increases, the more the value increases. On the given case we see how event the financing structure can become the source of value creation for shareholders and even a strategic competitive advantage of a company.
Is value creation in your company addressed in a sufficiently advanced way? Do you know the specifics and best practices that would fit your company best? Does your strategy hide innovative financial & business approaches or you think it is just another block of paper in your drawer? Which strategic decision may hit your competitors next?